Almost every test a TradeStation trader actually uses.
EdgeProof is opinionated: each tab answers one specific question about how your strategy behaved under testing. No fluff, no fake AI, no cloud uploads.
Generate
EasyLanguage code generation
EdgeProof generates the instrumented strategy code each test runs on — the optimization code, the trades-collection code and, at the end, the final live-trading strategy. You compile it in TradeStation; no manual rewriting.
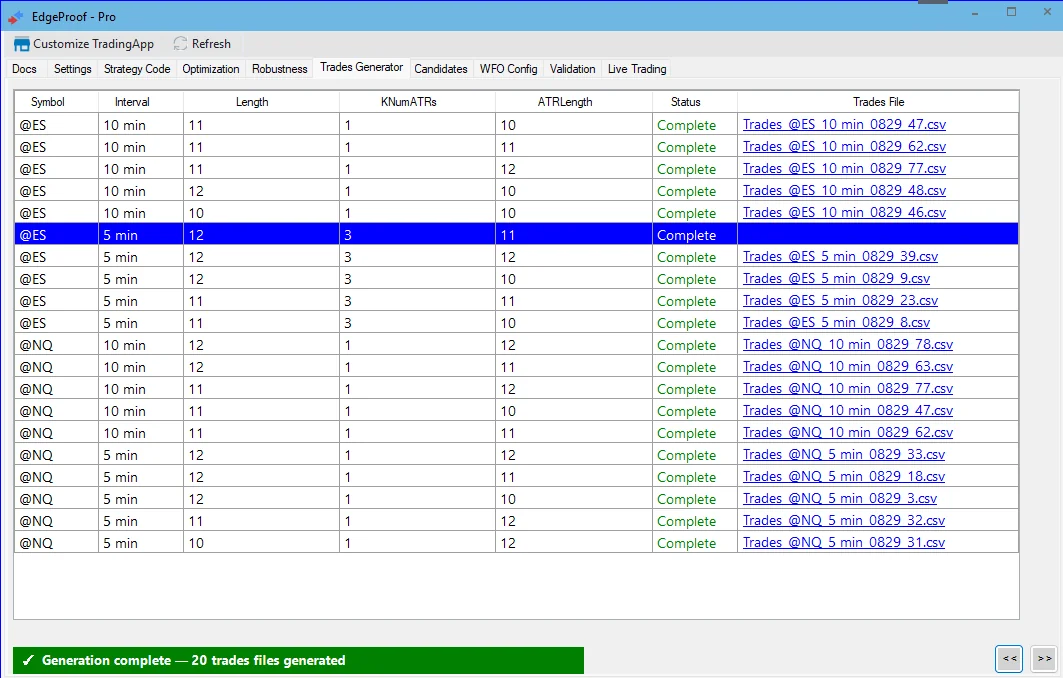
Trades Generator
Batch-run your strategy across symbols, intervals and parameter sets. Each combination produces a trades file ready for analysis — no manual exports.
WFO Config
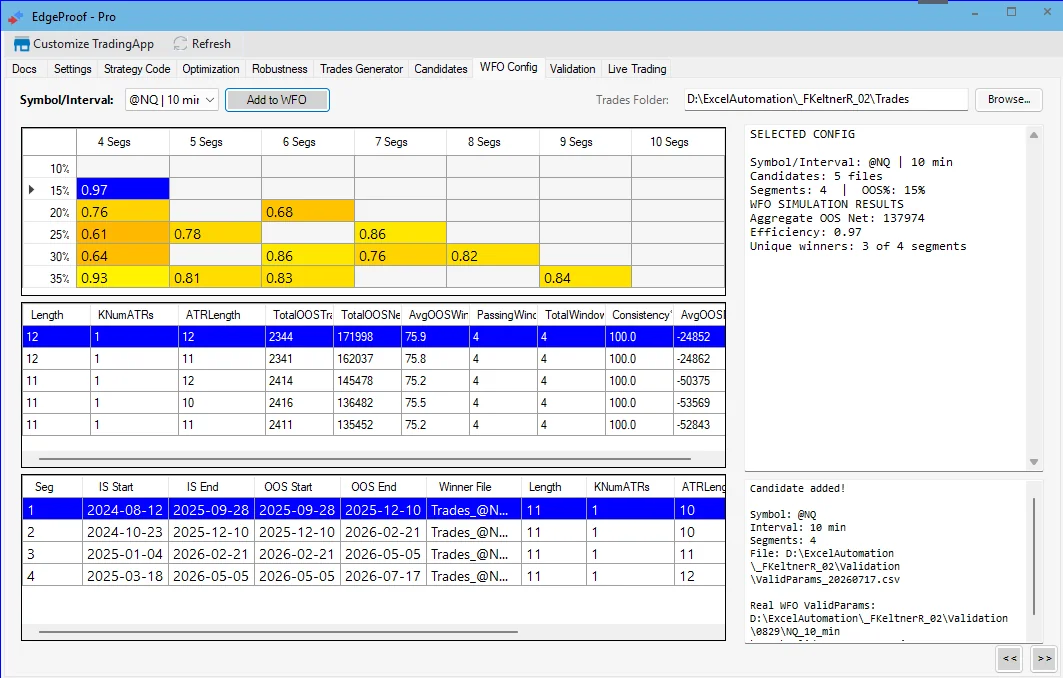
Pick the candidate pool, sweep a (Segments × OOS%) matrix, and lock a walk-forward configuration for Validation.
Validation
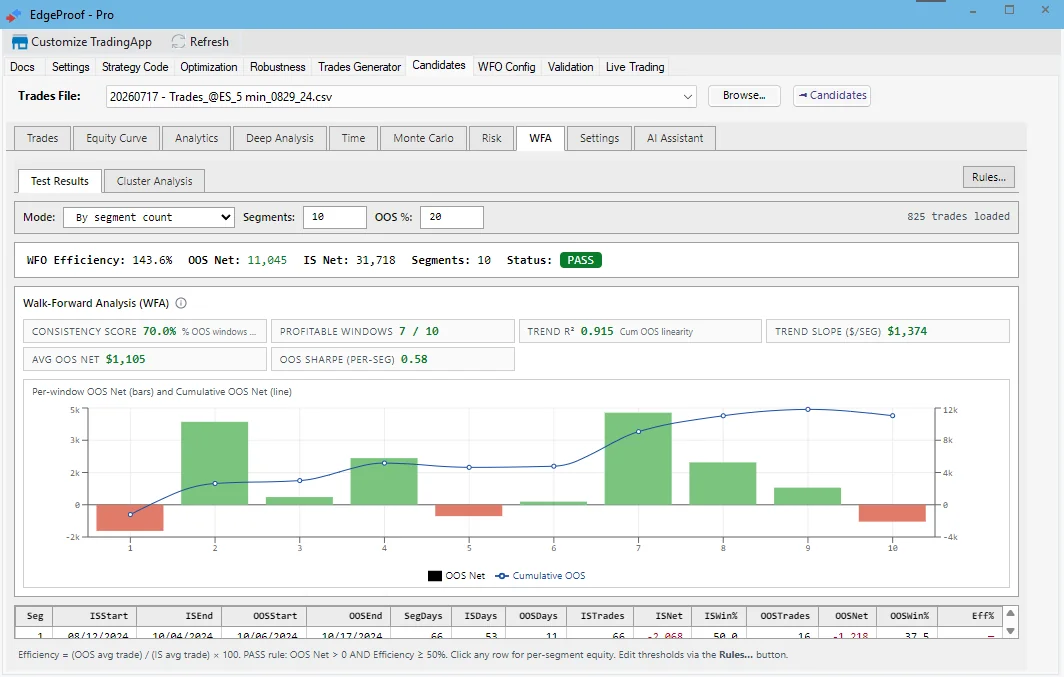
Walk-Forward Optimization
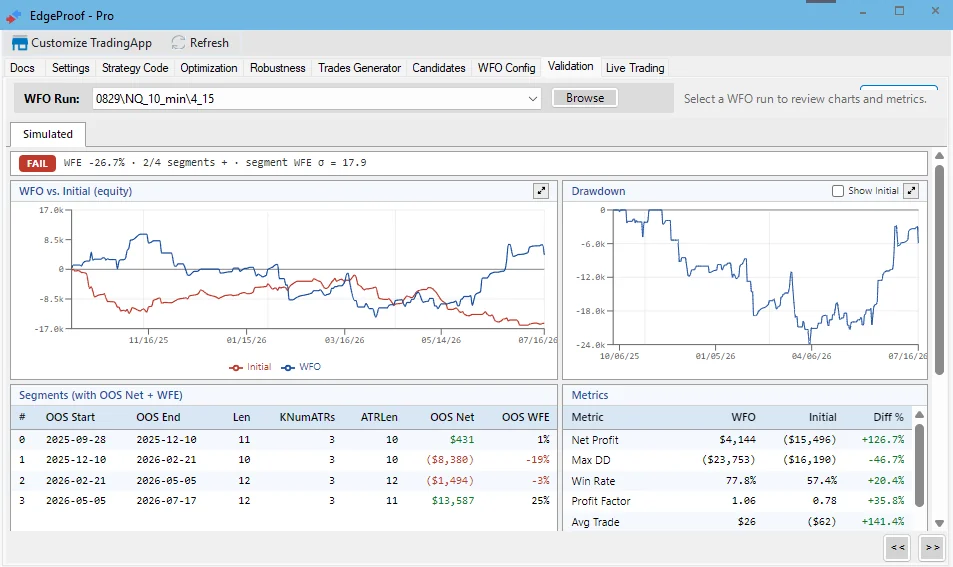
IS/OOS split with per-segment KPIs, an overall WFO Efficiency ratio (OOS / IS), and a per-segment table that shows which window broke down.
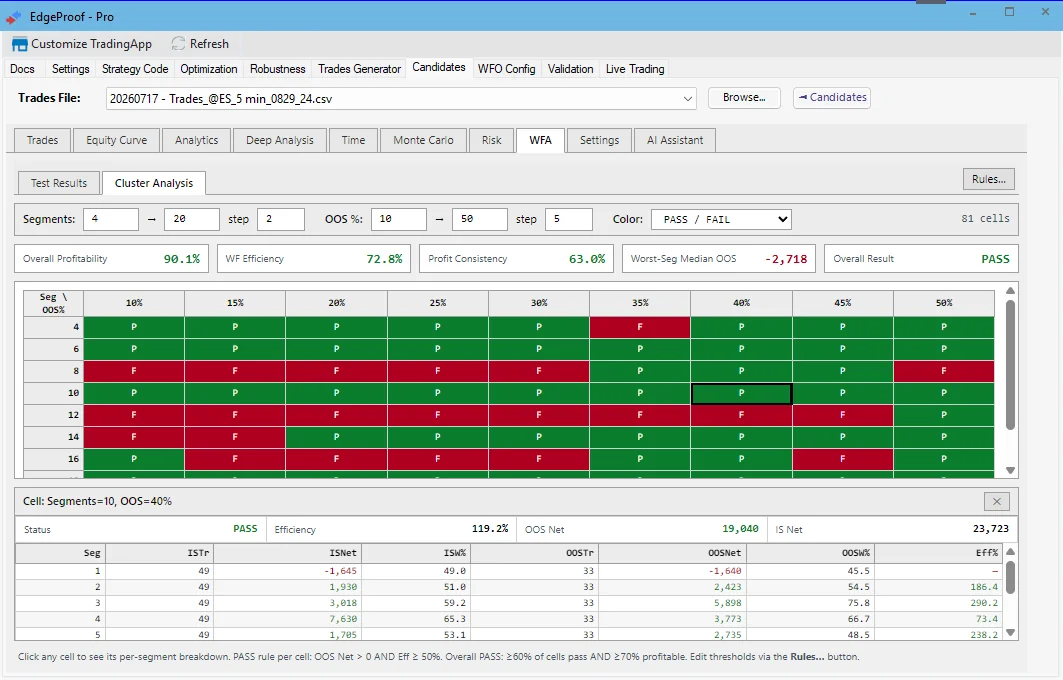
Cluster Analysis
A 2-D sweep over (Segments × OOS%), re-slicing results you have already produced. It shows whether a walk-forward configuration is representative or a lucky cell, without re-running the optimizer for every combination.
Monte Carlo + Risk of Ruin
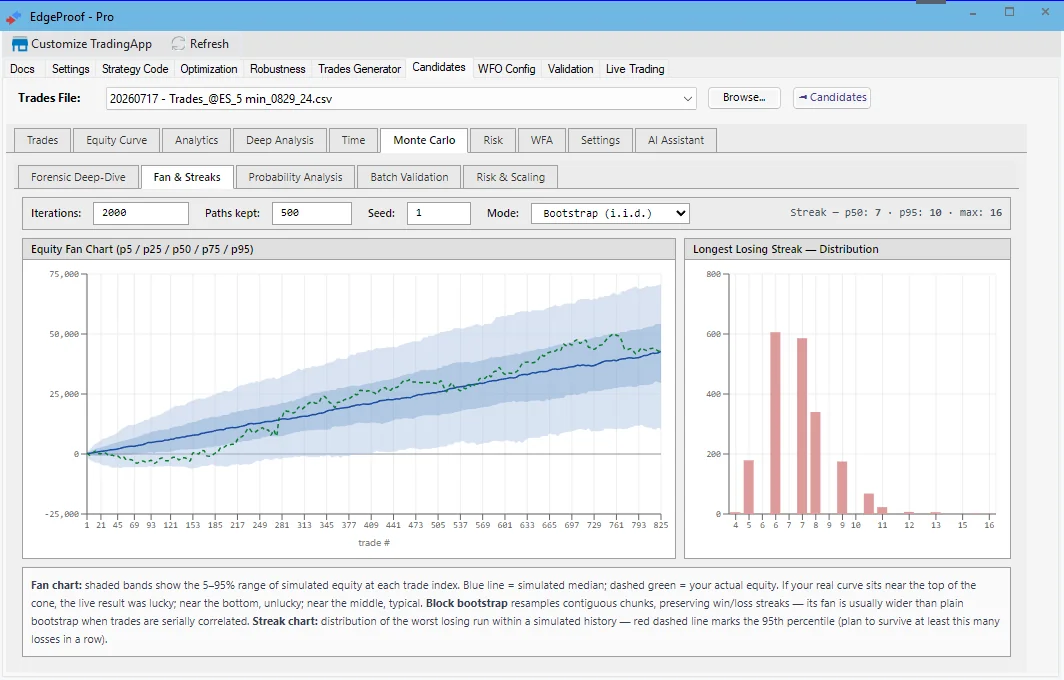
Resample trade returns with user-selected iterations. Reports median / 5th / 95th percentile equity, expected max drawdown, and Risk of Ruin.
Diagnostics
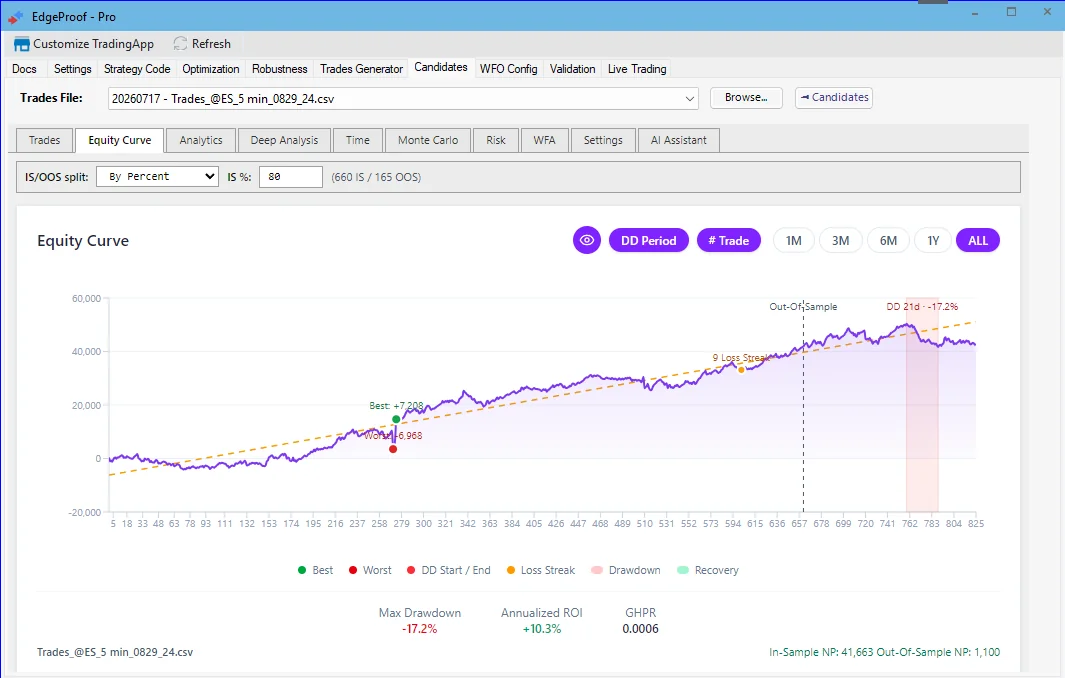
Equity Curve (IS/OOS aware)
Cumulative P&L with the IS/OOS boundary marked. The shape is the first qualitative signal — long flats and flattening tails are immediately visible.
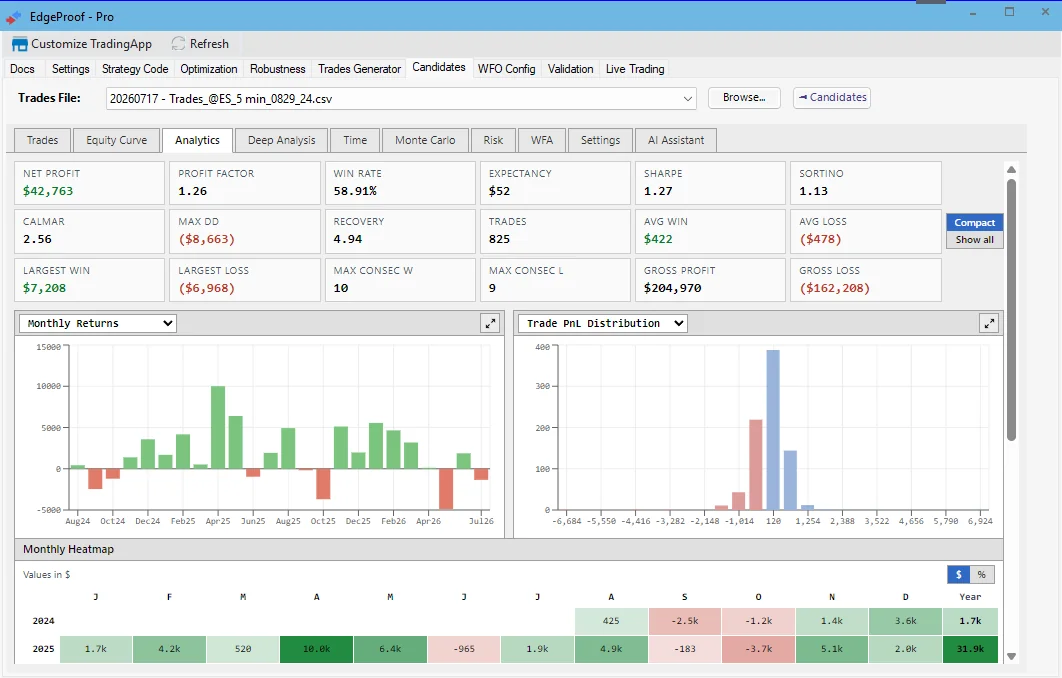
Analytics dashboard
Monthly returns, drawdown curve, monthly heatmap and trade distribution. The qualitative signals you check before any deeper test.
Validation runs
Compare a candidate's expected metrics against an actual live-equivalent run. Net P&L, Max DD, Win Rate, Profit Factor and Avg Trade — side by side with diff %.
Workflow
Time Analysis
Performance bucketed by hour-of-day, day-of-week and month. Spot the dominant session and the negative-expectancy buckets you should sit out.
Editable rule thresholds
Set thresholds for net profit, trades, profit factor, average trade, expectancy, drawdown and the binomial filter.
Native TradeStation integration
EdgeProof opens directly inside TradeStation Desktop and receives your strategy trades automatically — no exports, no copy-paste, no setup.
100% local computation
Your trade data is parsed and analyzed entirely on your machine. Nothing is uploaded, nothing is logged. Works offline after first load.
The whole workflow, tab by tab.
These are unretouched captures of EdgeProof running inside TradeStation Desktop, in the order you would actually use them.